4Presentation of indicators
At the website Environmental Indicators in Slovenia, all indicators are presented in the same way in order to ensure that indicators can be read by an average user.
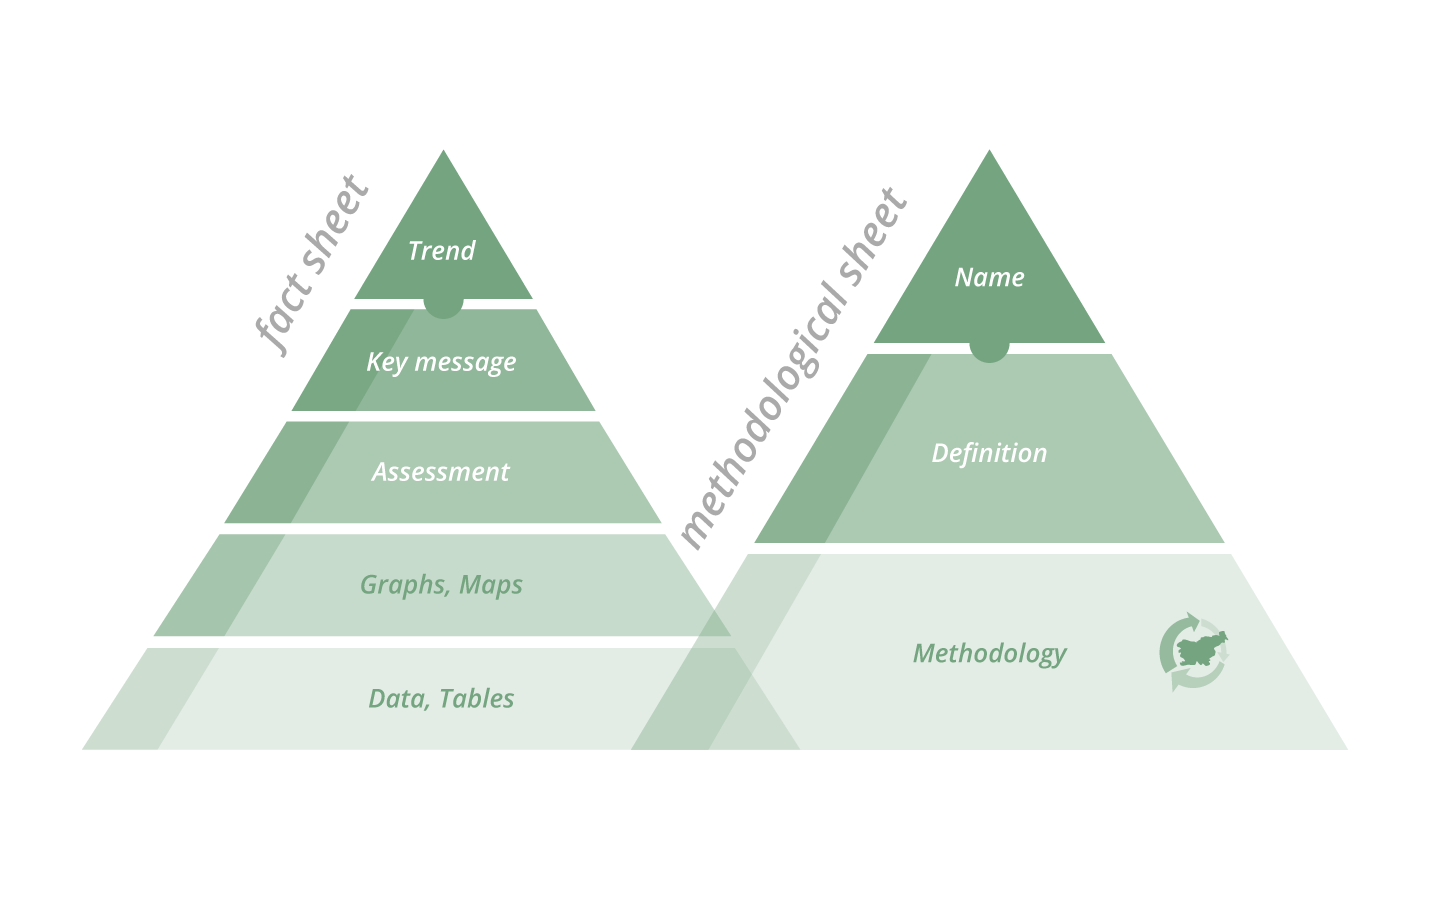
Each indicator has its fact sheet and methodological sheet, whose components are built hierarchically (Figure 3). The methodological sheet combines elements of the methodological description (the name of the indicator, definition, methodology). The fact sheet is based on information, its form of presentation (table, graph, chart), comment, the key message and trend assessment.
Figure 3: Methodology and fact sheet of indicators Source: European Environment Agency
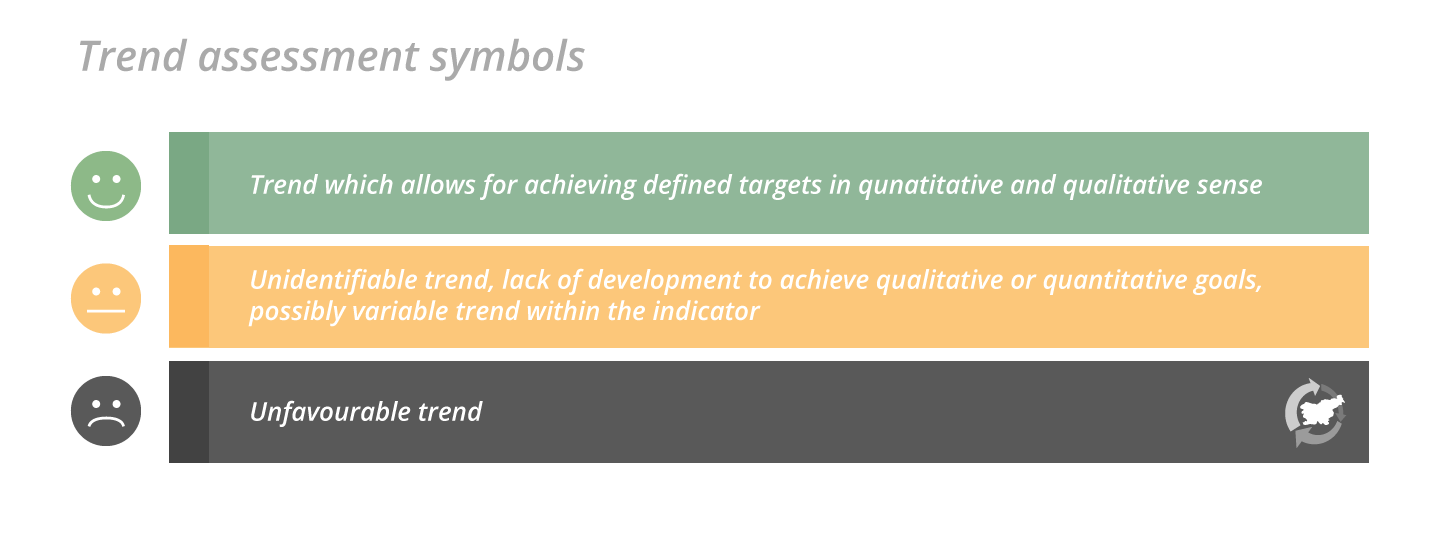
In addition to the above-mentioned elements, each indicator has its own code, unambiguous name, position marked in the DPSIR assessment framework and a trend assessment. The trend assessment is part of the expert judgement by the author of the indicator. It is described with a symbol, as shown in Figure 4. The highlights of the analysis which justify the expert decision on trend assessment are part of the key message of each indicator.
Crucial to assess the trend development of a certain phenomenon is knowledge of the desired direction and intensity of development. Therefore, the goal we want to monitor is provided with each indicator. The goal of an indicator facilitates its monitoring through temporal and spatial data set. It is defined by national and EU legislative bases, EU or global strategies (such as Agenda 2030) or recommendations of organisations such as the World Health Organisation, OECD.
Figure 4: Trend assessment symbolsSource: Environmental Indicators in Slovenia, 2017.

The definition of each indicator provides the fundamental information on the measurement and display method of the indicator. Due to benchmarking, we most frequently used methodological sheets for indicators prepared by the European Environment Agency. Where necessary, the methodology was adjusted to the situation in Slovenia or dictated by the phenomenon, the monitoring method of the phenomenon, the accessibility of information or other expert factors.
The quantity values of an indicator are most frequently expressed in annual values for the period beginning in 1992, and shown with graphs and tables, in some cases also with charts. A comment explaining the trend development and alleged causes of such development, and implemented and planned measures to improve or preserve a good state is added.
The “Methodology” section contributes to the clarity of the monitoring methods applied for selected indicators. This section fully describes data sources and provides additional methodological notes.
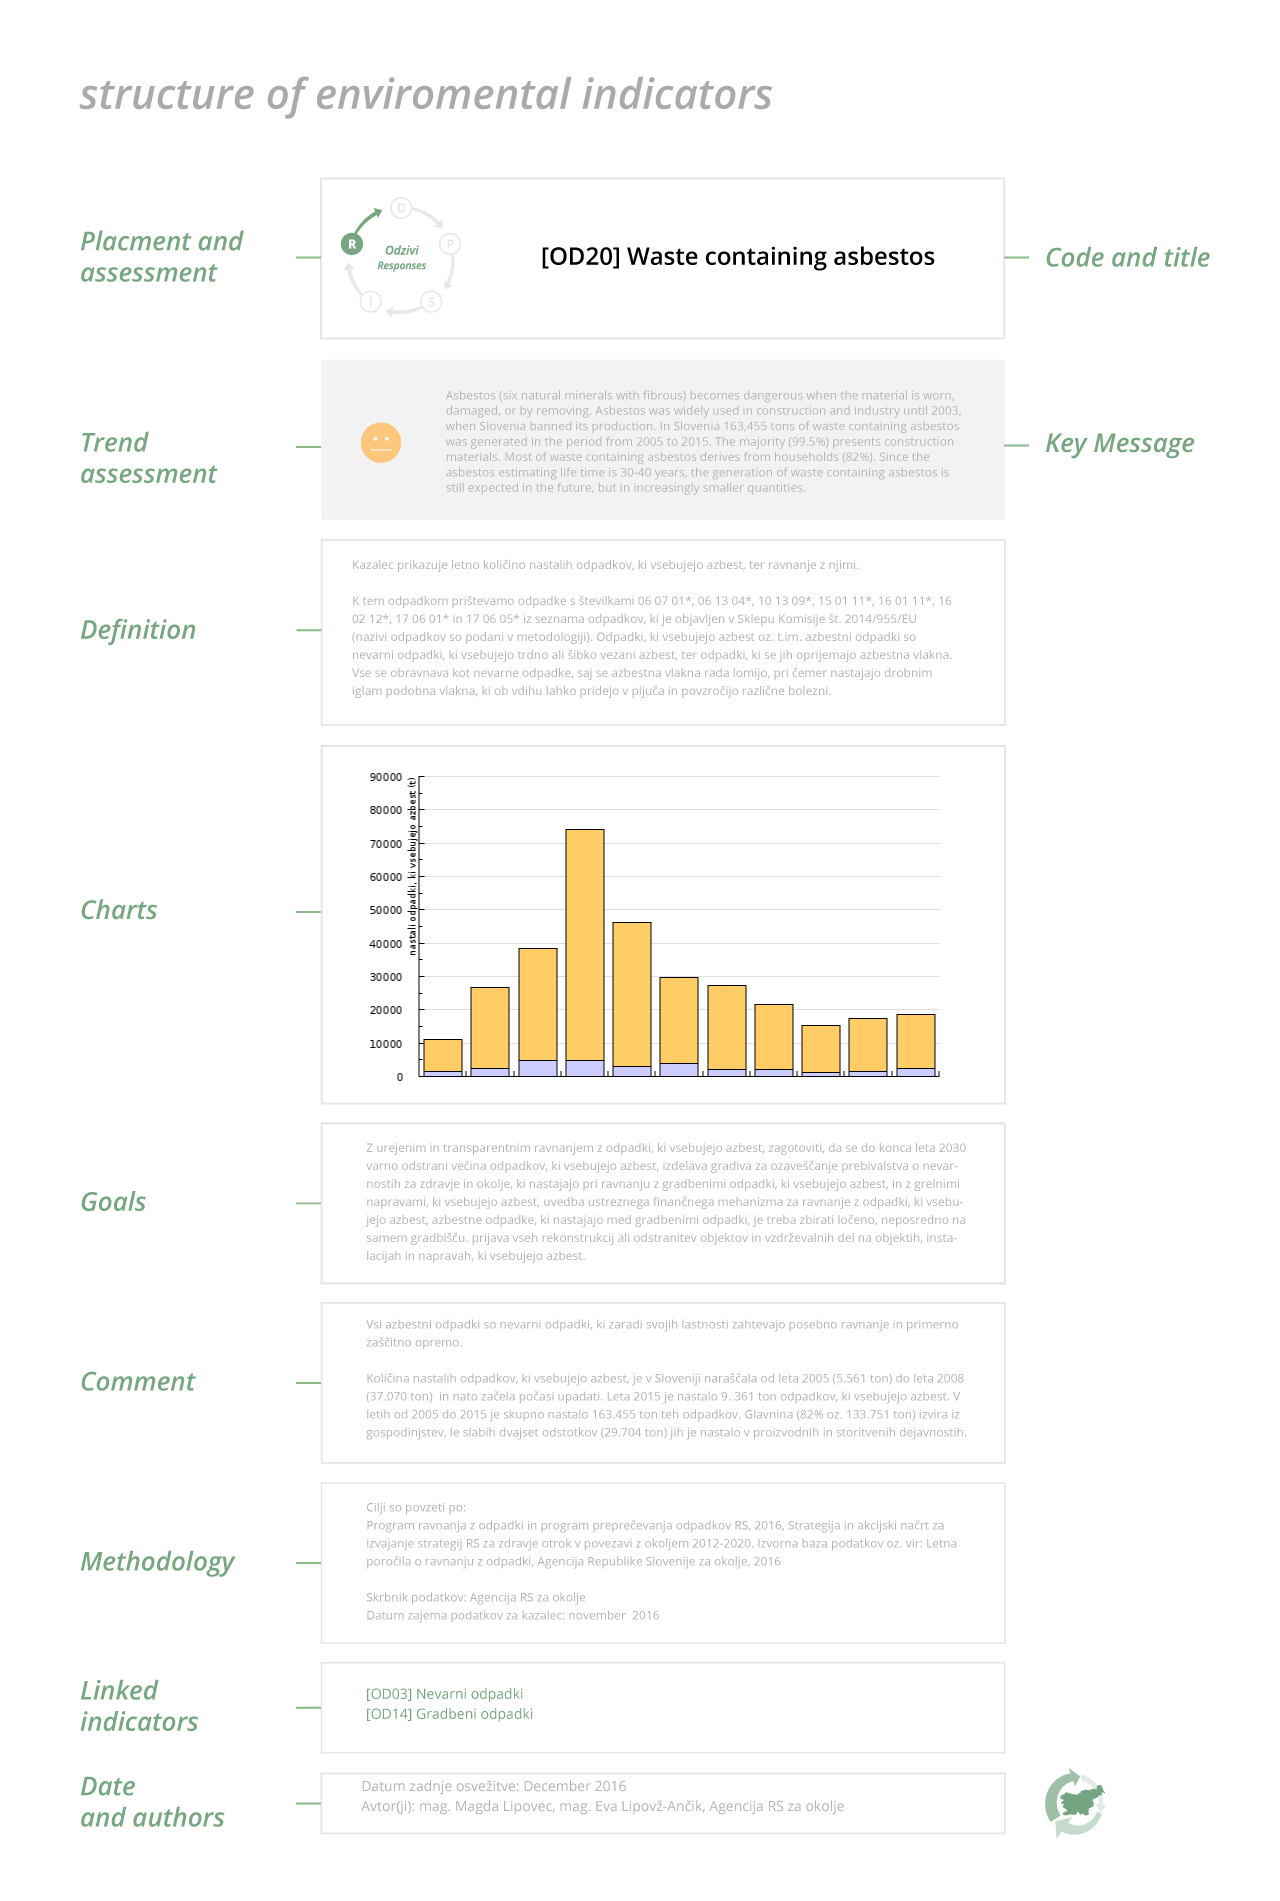
Figure 5: Format of selected indicators presented at the Environmental Indicators in Slovenia website